%20.png)
.png)
ROAS is one of the most common metrics in ecommerce advertising.
It is also one of the easiest to overinterpret.
A campaign with a 5x ROAS sounds better than one with a 3x ROAS.
But is it actually more profitable?
Is it acquiring more new customers?
Is it scalable?
Is the revenue incremental?
Are the products being sold high-margin or low-margin?
ROAS cannot answer those questions on its own.
That does not make ROAS a bad metric.
It makes it a specific metric with a specific job.
For ecommerce brands, ROAS is useful for understanding how much attributed revenue is being generated relative to advertising spend.
It is not the same thing as profit.
That distinction should shape how you use it.
What does ROAS mean in ecommerce?
ROAS stands for Return on Ad Spend.
It measures how much attributed revenue you generate for every dollar spent on advertising.
Shopify currently defines ROAS as the amount of revenue earned divided by the amount spent on a campaign. Shopify's marketing performance documentation
Google similarly defines ROAS as total conversion value divided by total spend. Google Ads glossary
The basic formula is:
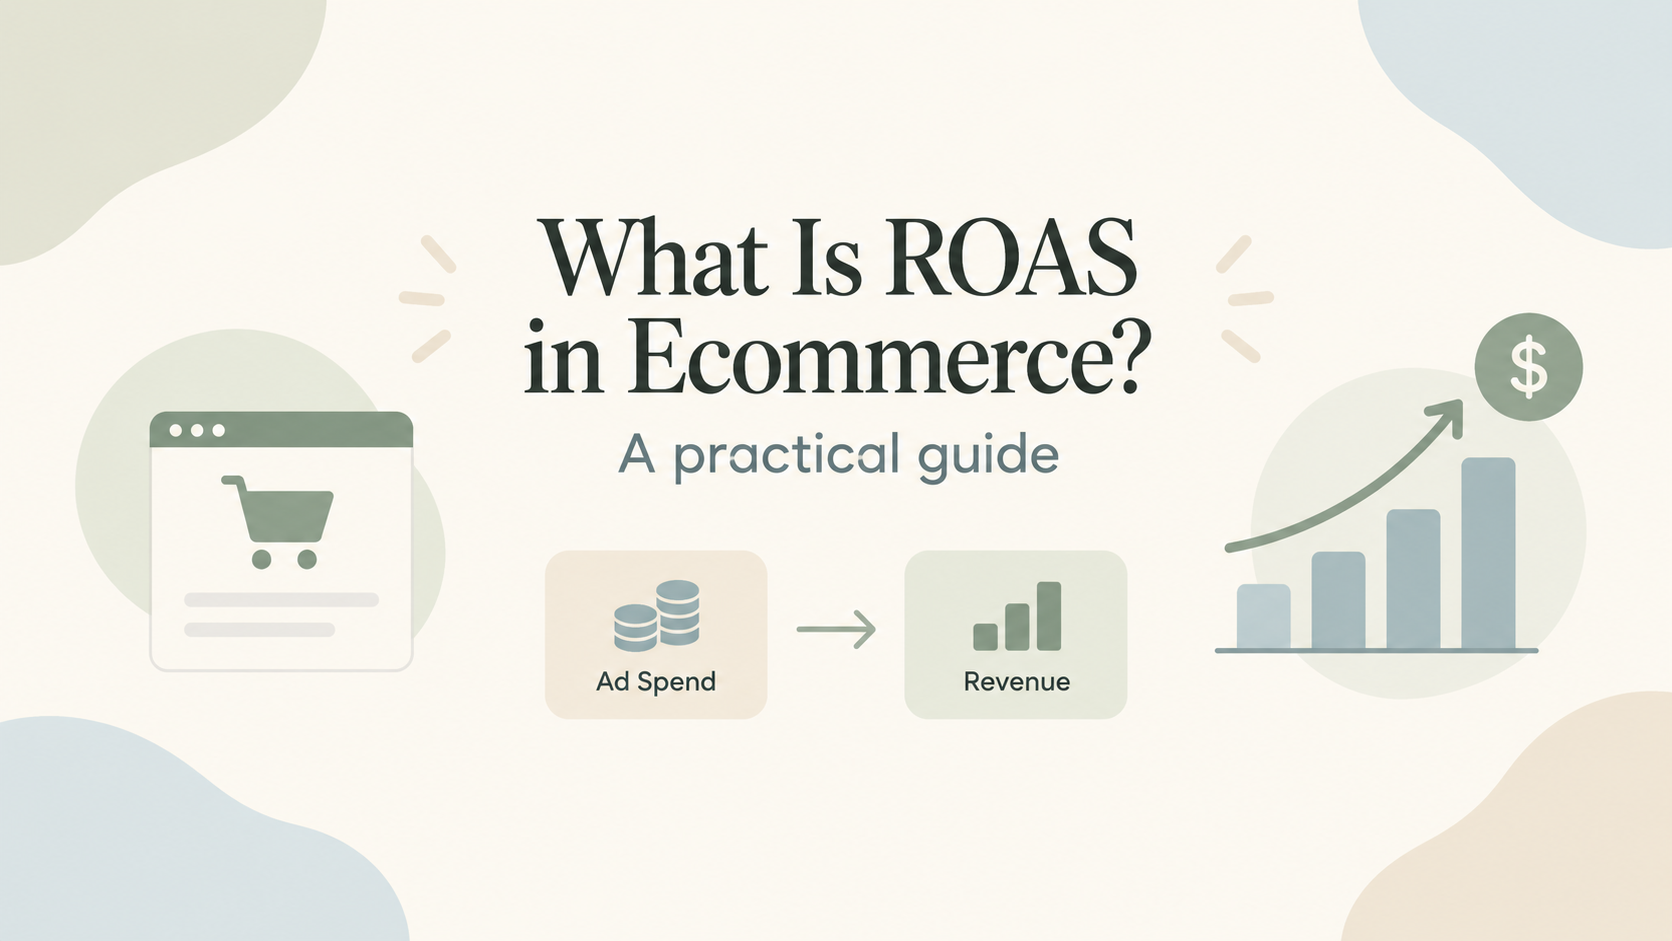
ROAS = attributed revenue ÷ ad spend
For example:
If you spend $10,000 on ads and the platform attributes $40,000 in revenue to those ads:
$40,000 ÷ $10,000 = 4.0 ROAS
You may also see that expressed as:
4x ROAS
or
400% ROAS
They mean the same thing.
For every $1 spent, the platform is reporting $4 in attributed revenue.
How do you calculate ecommerce ROAS?
The calculation is simple.
Take the revenue attributed to the advertising campaign and divide it by the amount spent.
Example 1: 3x ROAS
Ad spend: $5,000
Attributed revenue: $15,000
ROAS:
$15,000 ÷ $5,000 = 3x
Example 2: 6x ROAS
Ad spend: $20,000
Attributed revenue: $120,000
ROAS:
$120,000 ÷ $20,000 = 6x
Example 3: ROAS as a percentage
Ad spend: $10,000
Attributed revenue: $50,000
$50,000 ÷ $10,000 × 100 = 500% ROAS
Google uses this percentage format in Target ROAS bidding. For example, Google explains that a 500% target means the advertiser is seeking roughly $5 in conversion value for every $1 in spend. Google's Target ROAS documentation
What is a good ROAS for ecommerce?
There is no universal good ecommerce ROAS.
A 2x ROAS can be excellent for one business.
A 5x ROAS can be unprofitable for another.
The answer depends on the economics behind the revenue.
Important variables include:
- gross margin
- contribution margin
- average order value
- shipping and fulfillment costs
- discounts
- payment processing fees
- return rates
- new vs. returning customer mix
- repeat purchase behavior
- product mix
- attribution methodology
The better question is:
What ROAS does this business need to support its economics and growth objectives?
That is much more useful than comparing your account to a generic industry benchmark.
Why ROAS is not a profitability metric
This is the most important concept in the article.
ROAS compares revenue with advertising spend.
It does not automatically account for the cost of producing or fulfilling the order.
Imagine two brands.
Brand A
Ad spend: $10,000
Revenue: $40,000
ROAS: 4x
Product and variable costs: $15,000
Brand B
Ad spend: $10,000
Revenue: $40,000
ROAS: 4x
Product and variable costs: $30,000
The advertising platforms report the same ROAS.
The businesses do not have the same economics.
Brand A has much more room to absorb acquisition costs.
Brand B may be barely covering its variable costs.
This is why Google distinguishes ROAS from ROI in its own documentation. Google defines ROAS around conversion value relative to spend, while ROI is based on profit relative to costs. Google Ads on ROI
ROAS tells you about revenue efficiency.
Profitability requires additional information.
What is break-even ROAS?
Break-even ROAS is the point at which your contribution before advertising equals the cost of acquiring the order.
A simplified way to think about it is:
Break-even ROAS = 1 ÷ contribution margin percentage
For example:
If your contribution margin before advertising is 40%:
1 ÷ 0.40 = 2.5x break-even ROAS
That means, in this simplified example, a 2.5x ROAS would roughly cover advertising costs.
But be careful.
"Margin" can mean different things inside different businesses.
You need to know what has actually been included.
A proper contribution calculation might account for:
- cost of goods
- fulfillment
- shipping subsidy
- payment processing
- discounts
- commissions
- other variable costs
Do not base an acquisition strategy on a vague margin number.
A worked ROAS example
Suppose an ecommerce brand sells a product for $100.
The economics look like this:
Selling price: $100
Product cost: $30
Fulfillment and packaging: $8
Payment fees: $3
Shipping subsidy: $9
Contribution before advertising: $50
That gives the brand a 50% contribution margin before advertising.
Now suppose the business spends $20,000 on ads and attributes $60,000 in revenue.
ROAS:
$60,000 ÷ $20,000 = 3x
At first glance, 3x sounds good.
But at $60,000 in revenue and a 50% contribution margin before advertising:
Contribution before ads = $30,000
Minus advertising = $20,000
Contribution after advertising = $10,000
That is much more informative.
ROAS was only the first layer.
Why a higher ROAS is not always better
This is where ecommerce growth gets counterintuitive.
Imagine two months.
Month 1
Ad spend: $20,000
Revenue: $100,000
ROAS: 5x
Month 2
Ad spend: $50,000
Revenue: $200,000
ROAS: 4x
Month 1 has the better ROAS.
But Month 2 generated:
- $30,000 more ad spend
- $100,000 more attributed revenue
If the incremental customers were still economically attractive, Month 2 may be the better business outcome.
This is why maximizing ROAS is not always the same thing as maximizing profitable growth.
A brand can often make ROAS look better simply by spending less and concentrating budget on the easiest demand.
That may improve efficiency.
It may also restrict growth.
ROAS can become a vanity metric
This happens when the goal changes from:
Grow profitably
to:
Protect the ROAS number
Suppose a campaign reports 8x ROAS at $5,000 per month.
The business could potentially spend $20,000 and generate 5x ROAS.
If 5x is comfortably profitable, refusing to scale because the reported ROAS would fall may leave substantial revenue and profit on the table.
High ROAS is not inherently the goal.
The goal is economically attractive growth.
Average ROAS vs marginal ROAS
Average ROAS tells you what the total spend produced.
Marginal ROAS asks:
What did the additional spend produce?
This distinction matters when scaling.
Imagine:
At $50,000 spend, revenue = $250,000
Average ROAS = 5x
Increase spend to $70,000.
Revenue rises to $310,000.
New spend = $20,000
Incremental revenue = $60,000
Marginal ROAS = 3x
The account still reports a strong blended ROAS:
$310,000 ÷ $70,000 = 4.43x
But the last $20,000 behaved very differently from the first $50,000.
Google itself defines marginal ROAS as the additional return from additional spend, calculated from the increase in conversion value divided by the increase in spend. Google Ads glossary
That is often a much more useful scaling question than average ROAS.
ROAS does not tell you whether customers are new
This is another major limitation.
Imagine a campaign spends:
$10,000
and generates:
$50,000 attributed revenue
ROAS = 5x
Looks excellent.
But what if $35,000 came from existing customers who were likely to purchase anyway?
The acquisition story changes considerably.
For growing ecommerce brands, you may also want to track:
- new customers
- new-customer revenue
- new-customer CAC
- returning-customer revenue
- first-order contribution
Shopify's current marketing reporting separates first-time and returning customers alongside ROAS, CPA, conversion rate, AOV, and other channel metrics. Shopify marketing performance
That is a useful reminder:
Revenue efficiency and customer acquisition are related, but they are not identical.
Related: What Is Customer Acquisition Cost in Ecommerce?
ROAS is affected by attribution
The revenue in the numerator is usually attributed revenue.
That word matters.
Imagine a customer journey:
- Customer sees a Meta ad.
- Customer clicks.
- Customer leaves.
- Customer searches the brand on Google.
- Customer clicks a Shopping ad.
- Customer purchases.
Meta may claim some credit.
Google may claim some credit.
Shopify may assign credit differently depending on the reporting model.
There was only one order.
But multiple platforms may associate themselves with the transaction.
That is why a 5x Meta ROAS plus a 5x Google ROAS does not automatically mean your business actually generated a clean 10x return across those channels.
Platform ROAS is useful.
But it lives inside an attribution system.
Related: Ecommerce Attribution: Why Google Ads, Meta and Shopify Never Agree
Platform ROAS vs business performance
A strong ecommerce measurement system should usually have at least two views.
Platform view
Use Google and Meta reporting to understand:
- campaigns
- products
- creative
- audiences
- bidding
- search intent
- attributed revenue
These platforms need their own signals to optimize effectively.
Business view
Use broader ecommerce reporting to monitor:
- total revenue
- total ad spend
- new customers
- blended CAC
- MER
- contribution margin
- repeat revenue
- cash flow
The two views answer different questions.
You need both.
What is Target ROAS?
Target ROAS, often called tROAS, is an automated bidding approach in Google Ads.
You tell Google what return on ad spend you would like the bidding system to aim for.
For example:
Target ROAS = 400%
That means Google is trying to generate roughly $4 in conversion value for every $1 spent.
Google's current Target ROAS documentation says the system predicts conversion value and adjusts bids to maximize that value while trying to achieve the target return.
Google also warns that setting the target too high can limit traffic.
That is an important point.
A target is not free.
If you tell the system:
Only pursue extremely high-return opportunities
you may restrict how much it can spend.
That can improve reported efficiency while reducing total growth.
How should ecommerce brands set a Target ROAS?
Do not choose the number because it sounds ambitious.
Start with:
- Business economics
- Historical campaign performance
- Growth objectives
- Marginal performance
Google itself recommends considering business goals and historical ROAS when selecting a Target ROAS.
If a campaign historically operates around 400% ROAS, suddenly setting a 900% target is not a strategy for doubling profitability.
It may simply tell Google to become much more selective.
That can reduce traffic and conversion volume.
Conversion values matter too
ROAS is only as useful as the conversion value going into the system.
If your store sells orders at different values, dynamic purchase values are generally more useful than assigning every purchase the same arbitrary amount.
Google specifically recommends transaction-specific conversion values when individual sales have different values. Google's conversion value best practices
For ecommerce, that usually means passing actual purchase revenue accurately.
There are also more advanced approaches.
Google allows advertisers to use conversion value rules to adjust value based on factors such as audiences, devices, or location, and notes that value adjustments can reflect things like different margins or lifetime-value considerations. Google's conversion value rules
But complexity should come after reliable basics.
Bad inputs plus sophisticated bidding is still bad measurement.
What should you look at alongside ROAS?
This is where ROAS becomes much more useful.
Customer acquisition cost
CAC answers:
How much are we paying to acquire a new customer?
A campaign can have a strong ROAS while relying heavily on repeat customers.
CAC helps expose that.
Contribution margin
This answers:
How much money is actually available after variable costs?
A 4x ROAS on a high-margin product is different from a 4x ROAS on a low-margin one.
Average order value
Higher AOV can improve ROAS without necessarily improving customer acquisition efficiency.
Track both.
Conversion rate
A campaign may struggle because the traffic is expensive.
Or because the website converts poorly.
Those require different solutions.
New-customer revenue
This helps determine whether media is actually expanding the customer base.
MER
Marketing Efficiency Ratio gives a broader view of total revenue relative to advertising or marketing spend.
Related: MER vs ROAS: Which Metric Should Ecommerce Brands Use?
ROAS by product matters for ecommerce
Averages can hide bad product economics.
Imagine a Google Shopping campaign advertising three products.
Product A
ROAS: 8x
Margin: high
Inventory: strong
Product B
ROAS: 5x
Margin: low
Return rate: high
Product C
ROAS: 3x
Margin: high
Strong repeat-purchase behavior
Which product deserves more budget?
ROAS alone cannot answer that.
This is especially important in large catalogs.
Product economics, merchandising, inventory, and customer value should influence how media is managed.
Related: Google Shopping Ads: How They Work for Ecommerce Brands
Why branded traffic can inflate ROAS
Customers searching your brand name often have very high intent.
That can produce excellent paid-search ROAS.
But branded traffic is not the same thing as acquiring someone who had never heard of you.
Suppose:
Branded Search ROAS = 14x
Non-branded Search ROAS = 3x
Blended Google ROAS = 6x
That blended number may look excellent.
But if the objective is finding more new demand, the 6x figure does not fully describe what is happening.
Separate the components where possible.
Related: Branded vs Non-Branded Google Ads: How Ecommerce Brands Should Measure Them
Does a lower ROAS mean your ads got worse?
Not necessarily.
ROAS can decline when:
- spend increases
- the business expands into colder audiences
- prospecting increases
- branded demand represents less of the mix
- AOV falls
- promotions change
- new-customer acquisition grows
- product mix changes
Some of those could be bad.
Some could be deliberate investments in growth.
Context matters.
Suppose ROAS falls from 6x to 4.5x while:
- spend doubles
- new customers increase 80%
- total contribution grows
- blended CAC remains acceptable
That may be a very healthy trade.
Do not diagnose a business from one ratio.
Does a high ROAS mean you should spend more?
Maybe.
The right question is what happens at the margin.
If you increase spend and remain above your acceptable economics, continuing to scale may make sense.
If the next block of spend falls below your required contribution threshold, scaling becomes less attractive.
This is why good budget decisions usually involve:
- historical ROAS
- marginal ROAS
- CAC
- contribution
- inventory
- cash flow
- business objectives
Not ROAS alone.
Common ROAS mistakes ecommerce brands make
Treating ROAS as profit
It isn't.
Always understand margin.
Chasing the highest possible ROAS
This can lead to underspending and missed growth opportunities.
Ignoring new vs. returning customers
Repeat-customer revenue can make acquisition look stronger than it really is.
Comparing Meta and Google ROAS as though attribution is identical
The platforms may assign credit differently.
Comparing brands with different economics
A 3x ROAS can be great for one company and terrible for another.
Ignoring product mix
Different products have different margins and customer value.
Setting aggressive Target ROAS goals without understanding the tradeoff
A higher target can restrict delivery and total conversion value.
Optimizing platform metrics without checking total business performance
The dashboard should not become more important than the P&L.
What should a growing ecommerce brand do with ROAS?
Use it as one layer of the decision.
A practical measurement stack might look like this:
ROAS
How much attributed revenue is the channel generating relative to spend?
CAC
What does it cost to acquire a new customer?
Contribution
Is the customer economically attractive?
MER
What is happening across the whole business as marketing spend changes?
New-customer revenue
Are we actually expanding demand?
Marginal efficiency
What happens to the next dollar of spend?
Together, those metrics tell a much stronger story.
ROAS is useful when you ask it the right question
ROAS deserves a place in ecommerce reporting.
It is intuitive.
It is easy to calculate.
And it can help compare campaign, product, and channel efficiency.
The problem starts when you ask ROAS to answer questions it was never designed to answer.
ROAS does not tell you profit.
It does not automatically tell you incrementality.
It does not tell you whether customers are new.
It does not tell you how much you should scale.
It does not understand your contribution margin.
It tells you:
How much attributed conversion value did we generate relative to the advertising spend?
That is useful.
Then keep going.
Want to improve paid growth without managing to a single ROAS number?
Wild Mushroom helps ecommerce brands manage paid acquisition around the economics of the business, not just the metrics inside an advertising platform.
That means looking at Google Ads and Paid Social alongside conversion rate, AOV, CAC, contribution margin, new-customer revenue, product mix, merchandising, and where the next dollar should go.
If your campaigns are generating revenue but it is still unclear whether you are scaling the right products, acquiring enough new customers, or spending at the right level, explore Wild Mushroom's ecommerce paid growth services.
Built for what grows next.